The Big Picture — Key Trends in Charts
The big trends moving money in 2026 — U.S. debt, world debt, oil, the AI spending boom, the cost of living, China’s export surge, the U.S.–China rivalry, world trade, U.S. energy, natural resources and where investment money is flowing — each told in a few charts. The numbers come from Visual Capitalist’s subscriber deep-dives (which draw on the IMF, CBO, U.S. Treasury, IEA, BLS and others). The charts and wording are our own.

U.S. Debt — How We Got to $40 Trillion
Federal debt has passed $40 trillion, and the part owed to the public is now about the size of the whole economy — the first time since World War II. Each big jump came from a crisis (wars, 2008, COVID), but this time the debt never came back down. Interest on the debt now costs more than the entire defense budget.
World Debt — $111 Trillion and Climbing
Governments around the world owe $111 trillion, five times what they owed in 2000. That is about 95% of the whole world economy, and the IMF expects it to pass 100% by 2029. Just two countries — the U.S. and China — hold more than half of it, and almost every country is still spending more than it takes in.
Oil & the Strait of Hormuz
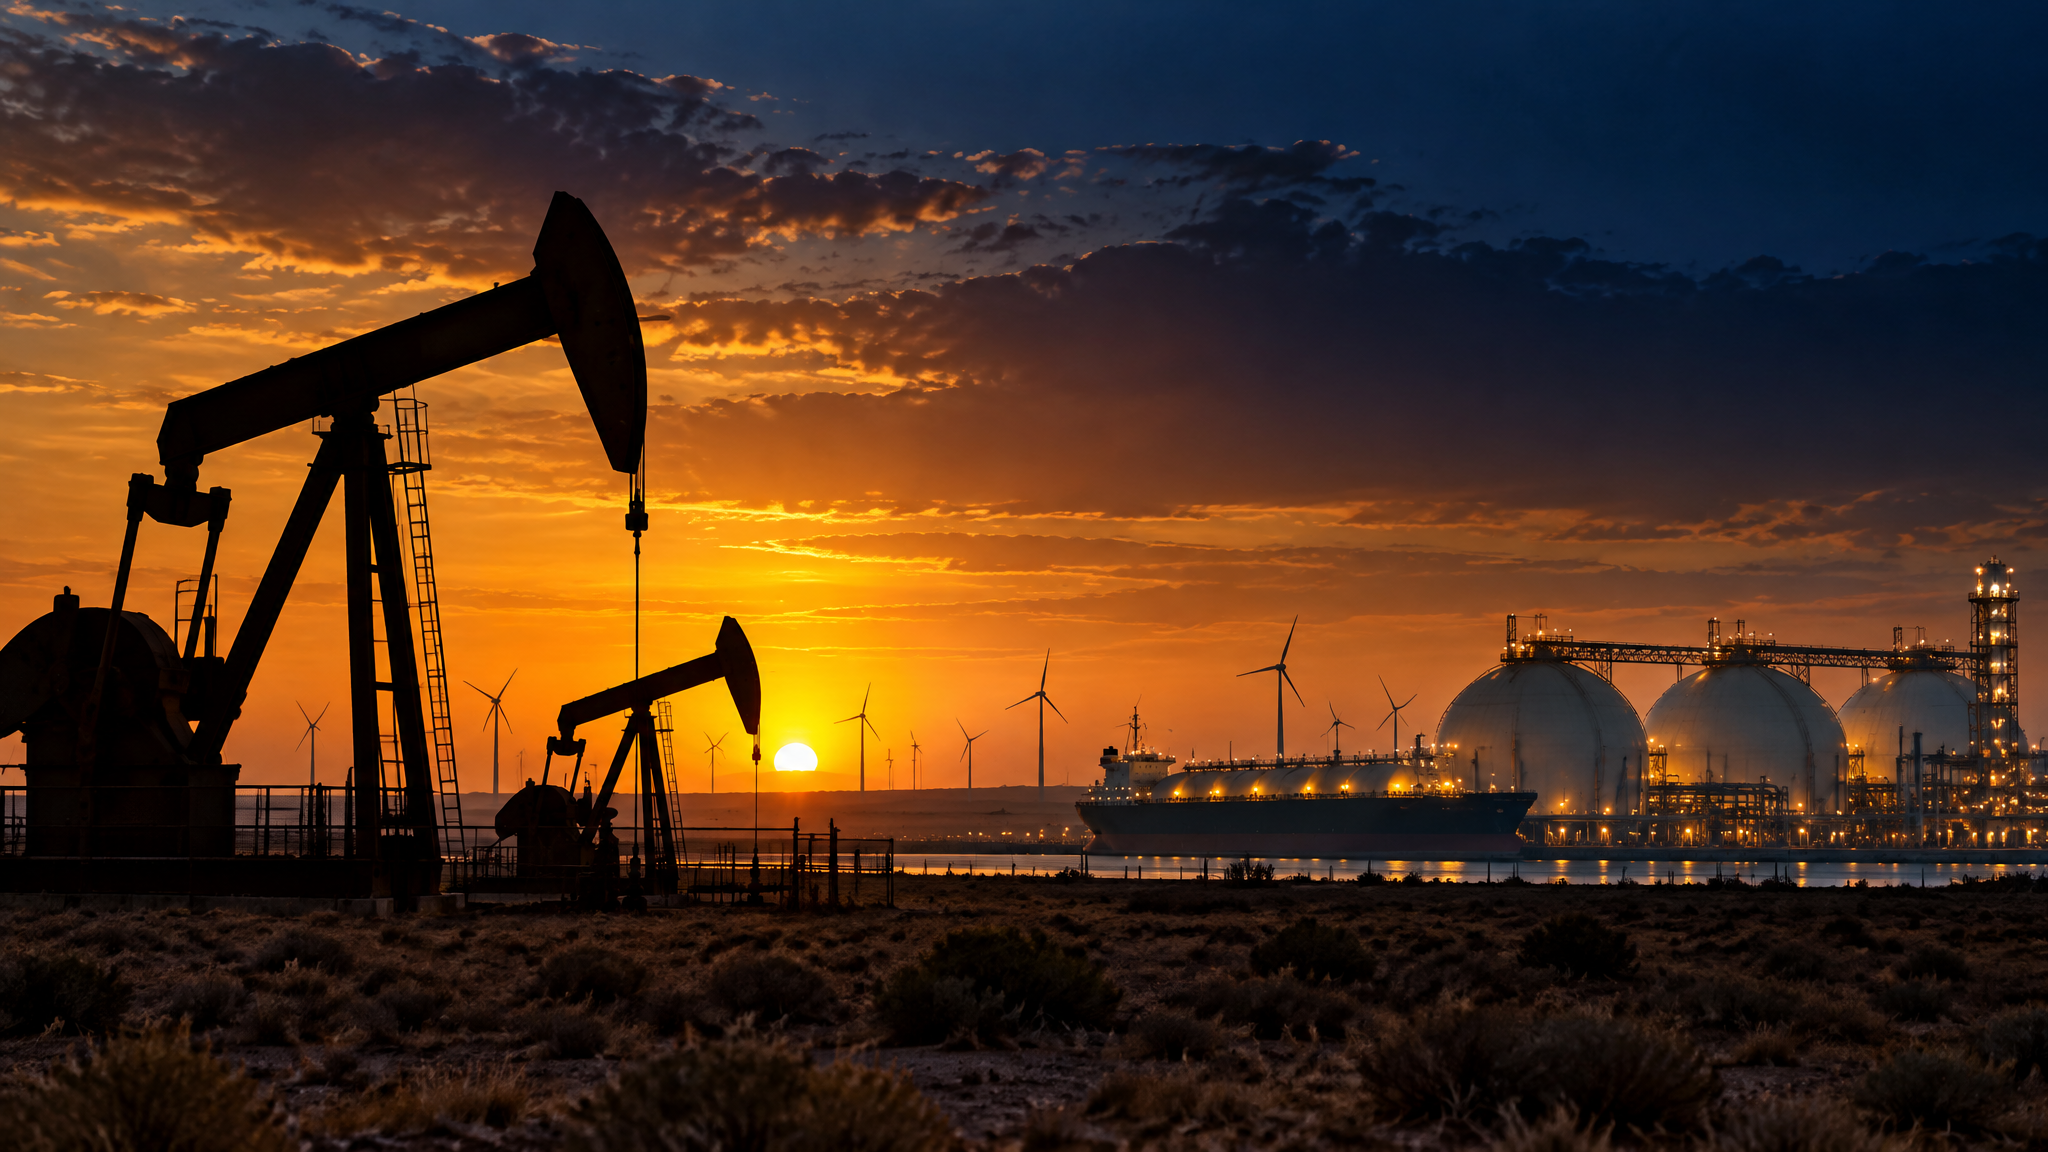
The Iran war closed the Strait of Hormuz, trapping roughly 20% of the world’s oil supply — more than double the Suez Crisis (1956) or the 1973 Arab embargo. Asia is hit hardest, since about 90% of that oil heads there. The U.S. is now a top oil exporter, which cushions America far more than in the 1970s.
The AI Boom & the Great Capital Rotation
Money is pouring out of apps and ads and into chips, data centers, power grids and minerals. AI companies have grown from 4% to 28% of the stock market in rich countries since 2010. The biggest tech firms plan to spend about $725 billion on AI buildings and hardware in 2026 alone. That is the same kind of all-in bet we saw in the 1999–2000 Dot-Com era, which is still our closest historical match.
Affordability — What Everyday Life Costs Now
Prices are up about 26% overall since 2019, but the essentials rose faster: car insurance, utilities, rent and groceries. Then the Iran war pushed gas up 24% in a month and fertilizer up 50%, which shows up in food prices later. Affordability now ranks as the world’s #1 worry.
China Shock 2.0 — From Cheap Goods to High-Tech
The first “China Shock” in the 2000s was cheap clothes, shoes and furniture. The second one is electric cars, batteries, solar panels and machinery — the industries rich countries thought they owned. China ran a record $1.19 trillion trade surplus in 2025, and its factory surplus alone now equals about 2% of the rest of the world’s GDP. The weak spot: it still imports most of its advanced chips, fuel and raw materials.
U.S. vs. China — Who Holds the Leverage
The U.S. still holds the money cards: the world’s main financial center and the reserve currency. China holds the factory and the raw-material cards: its industrial output is up 37% since 2019 while U.S. output has barely recovered, it is now the top trading partner for most countries, and it refines most of the minerals that chips, batteries and weapons need. Tariffs can change in one meeting; refining capacity takes a decade.
The Global Trade Machine — $71 Trillion and Slowing
World trade hit a record $71.3 trillion in 2025 — 15 times bigger than in 1980. But as a share of the world economy, trade peaked in 2022 and has flattened out as countries bring factories home or move them to friendly nations. The WTO expects goods-trade growth to slow from 4.6% in 2025 to 1.9% in 2026 as tariffs bite. Services and computer chips are the fastest-growing parts.
The U.S. Energy Revolution — From Importer to Supplier
In one generation the U.S. went from worried oil importer to the world’s biggest oil and gas producer. Shale drilling took crude output from 5.0 to 13.6 million barrels a day (2008–2025). OPEC now supplies only about 5% of U.S. crude, and the country runs an energy trade surplus instead of a deficit. That is a big reason the 2026 oil shock hurt Europe and China more than America.
Who Controls the World’s Natural Resources
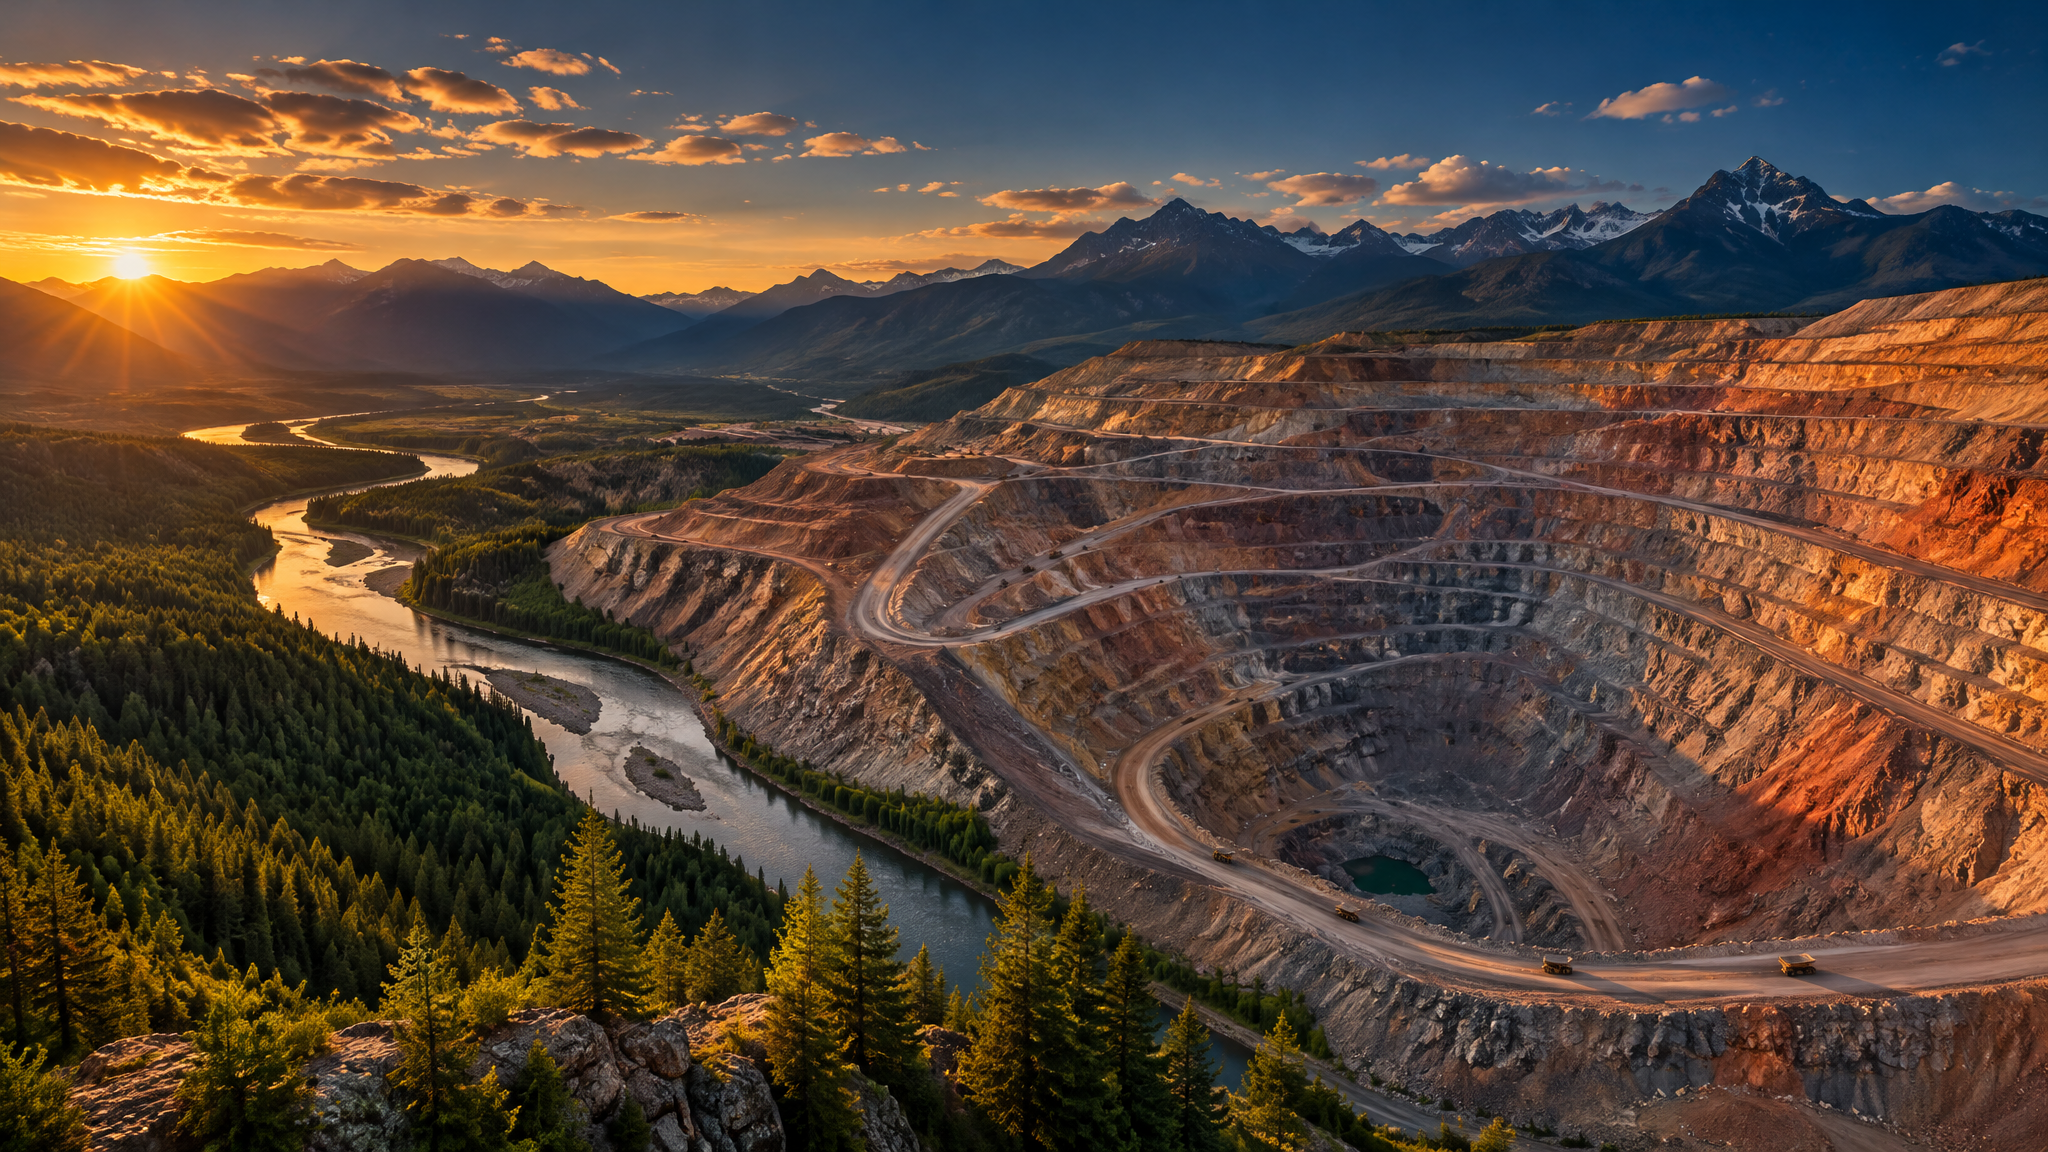
Food, water, energy and minerals start in a surprisingly small number of countries — and the countries with the most in the ground are not always the ones supplying the world. Venezuela has the most oil but pumps little; Saudi Arabia pumps more than seven times as much. A few countries hold most of the cobalt, platinum, phosphate and rare earths, so the whole world depends on them whether it wants to or not.
Following the Money — Power Grids, Minerals & Rearmament
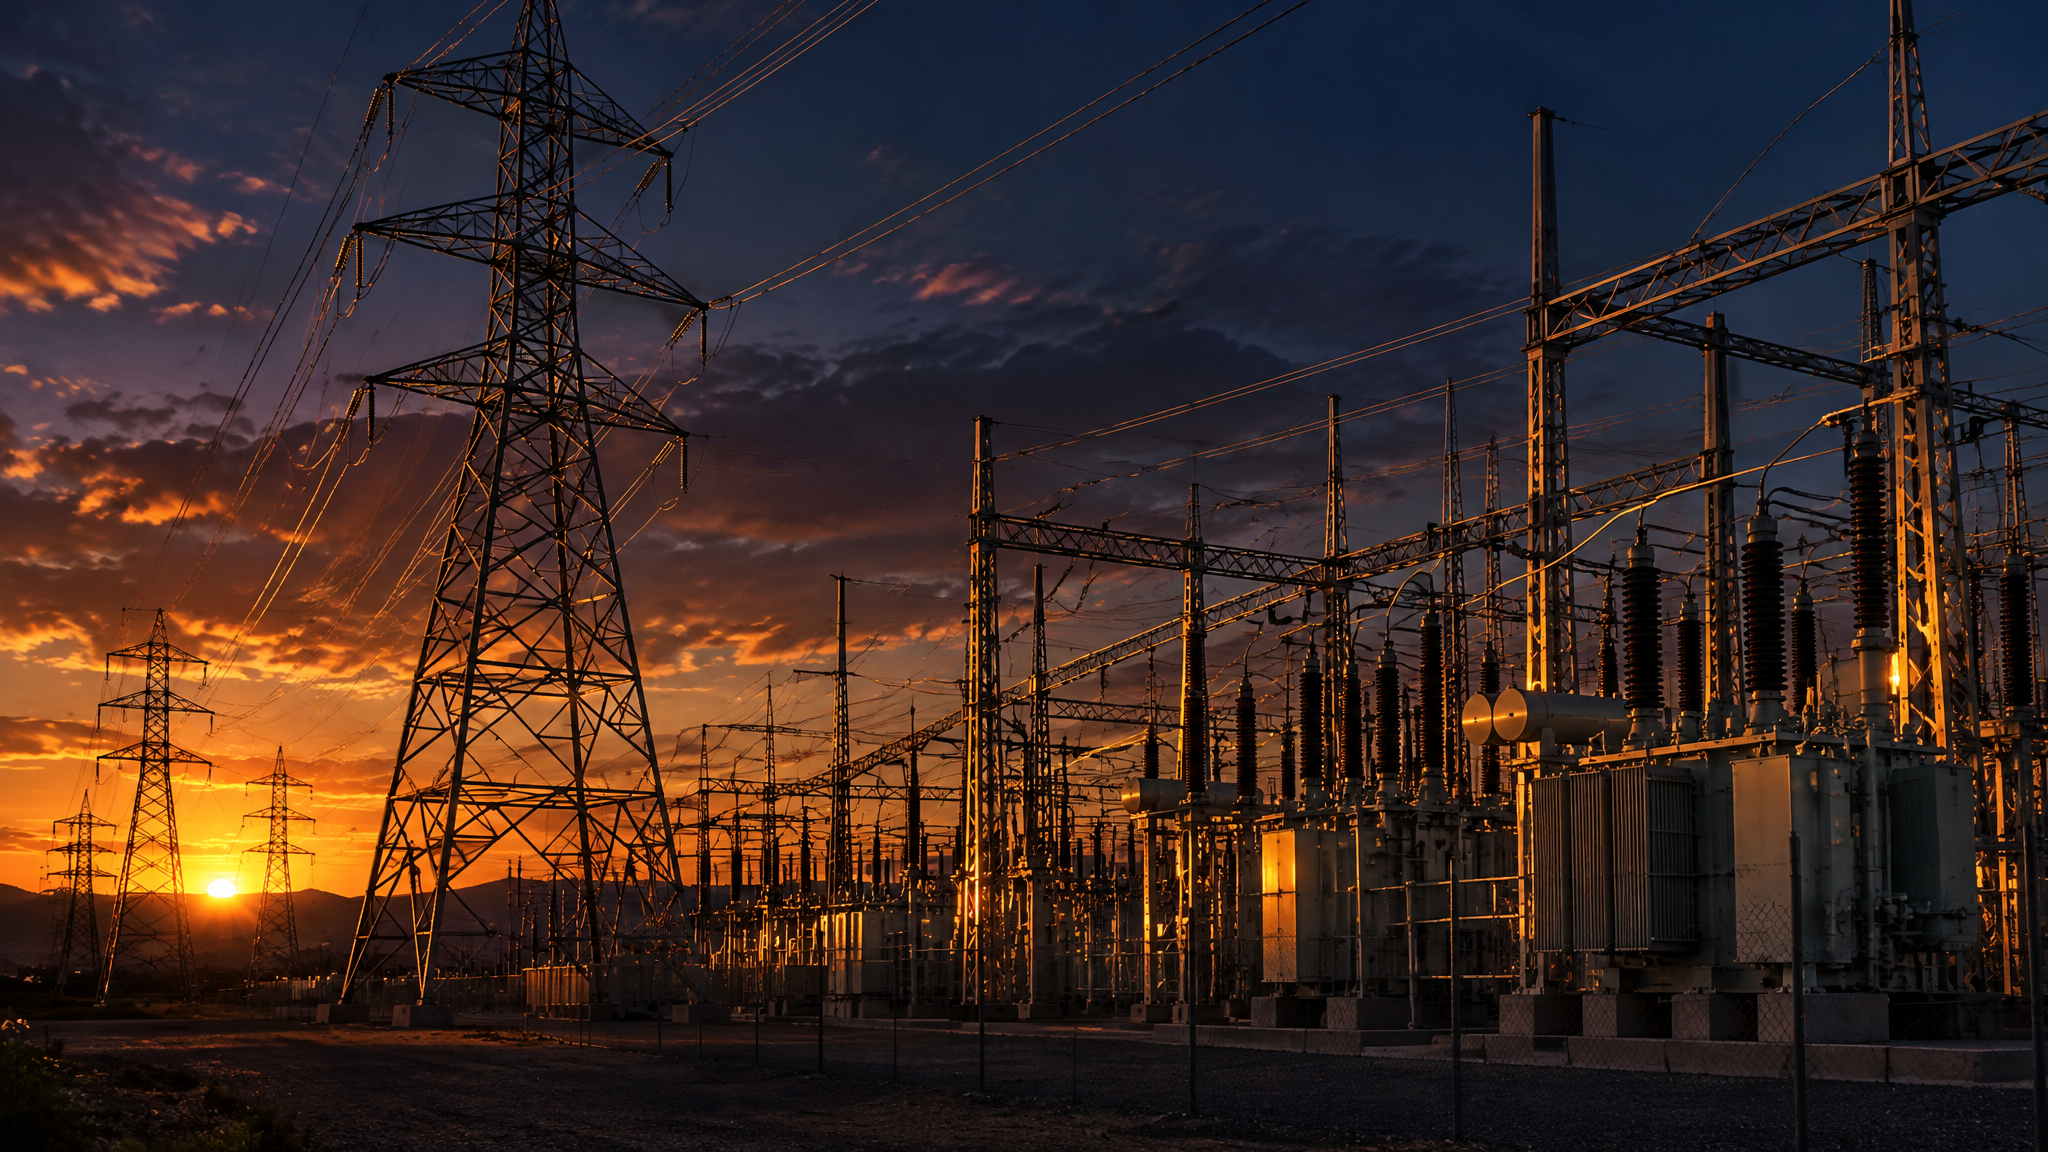
The AI boom (see above) is only the first leg. Trillions are also moving into the things AI and a more dangerous world need: power plants, grid lines, transformers, critical minerals and weapons. Electricity has quietly become the bottleneck — China’s power output grew 74% in ten years while America’s grew 6%. And NATO countries have pledged to lift defense spending to 5% of GDP by 2035.
About these numbers
Figures come from Visual Capitalist’s VC+ subscriber Special Dispatches (2026), which cite the IMF, Congressional Budget Office, U.S. Treasury, Federal Reserve, IEA, BLS, OECD, BloombergNEF and others. We rebuilt every chart ourselves and the wording is our own. Numbers are as published on each dispatch date and may since have changed.
We skipped VC+ topics that don’t bear on market or economic cycles (languages, travel, entertainment, best places to live). New dispatches are added here as they come in.