Back to 23 · Disaster Preparedness
23.8
Heat Watch — Extreme Heat & Drought
Live heat alerts from the National Weather Service and this week’s U.S. Drought Monitor numbers and map — plus what the alerts and drought levels mean, the deadliest U.S. heat waves and droughts, how heat and drought hit food prices and the power grid, and what to do.
U.S. heat & drought threat: Watch
No heat alerts right now. 42% of the U.S. is in moderate drought or worse (7.9% extreme or exceptional).
Checked Nov 17, 5:28 PM CT
Source: NWS + U.S. Drought Monitor + NOAA CPC
Extreme heat warnings / watches
0 / 0
Across the U.S. right now
Heat advisories
0
Hot enough to make careless people sick
U.S. area in drought (D1+)
41.7%
Drought Monitor of Nov 10, 2026 · +6.8 pts vs. week before
Extreme or exceptional (D3–D4)
7.9%
1.84% exceptional (D4) · +1.3 pts vs. week before
U.S. heat alerts
Worst first. One row per alert area.
No heat alerts in the U.S. right now.
Drought — this week vs. before
Percent of U.S. area at each level or worse (the Drought Monitor counts D1 as D1-or-worse). Updated each Thursday.
| Week | D0+ | D1+ | D2+ | D3+ | D4 |
|---|---|---|---|---|---|
| Nov 10, 2026 | 67.0 | 41.7 | 21.1 | 7.9 | 1.8 |
| Nov 10, 2026 | 56.2 | 34.9 | 17.6 | 6.6 | 1.5 |
| Oct 27, 2026 | 72.7 | 49.5 | 26.7 | 9.4 | 1.7 |
| Nov 4, 2025 (1 yr ago) | 67.7 | 43.7 | 20.4 | 3.8 | 0.1 |
Maps — drought now and the weeks ahead
The Drought Monitor map (yellow = abnormally dry up to dark red = exceptional drought), NOAA’s 8–14 day temperature odds and the seasonal drought outlook.
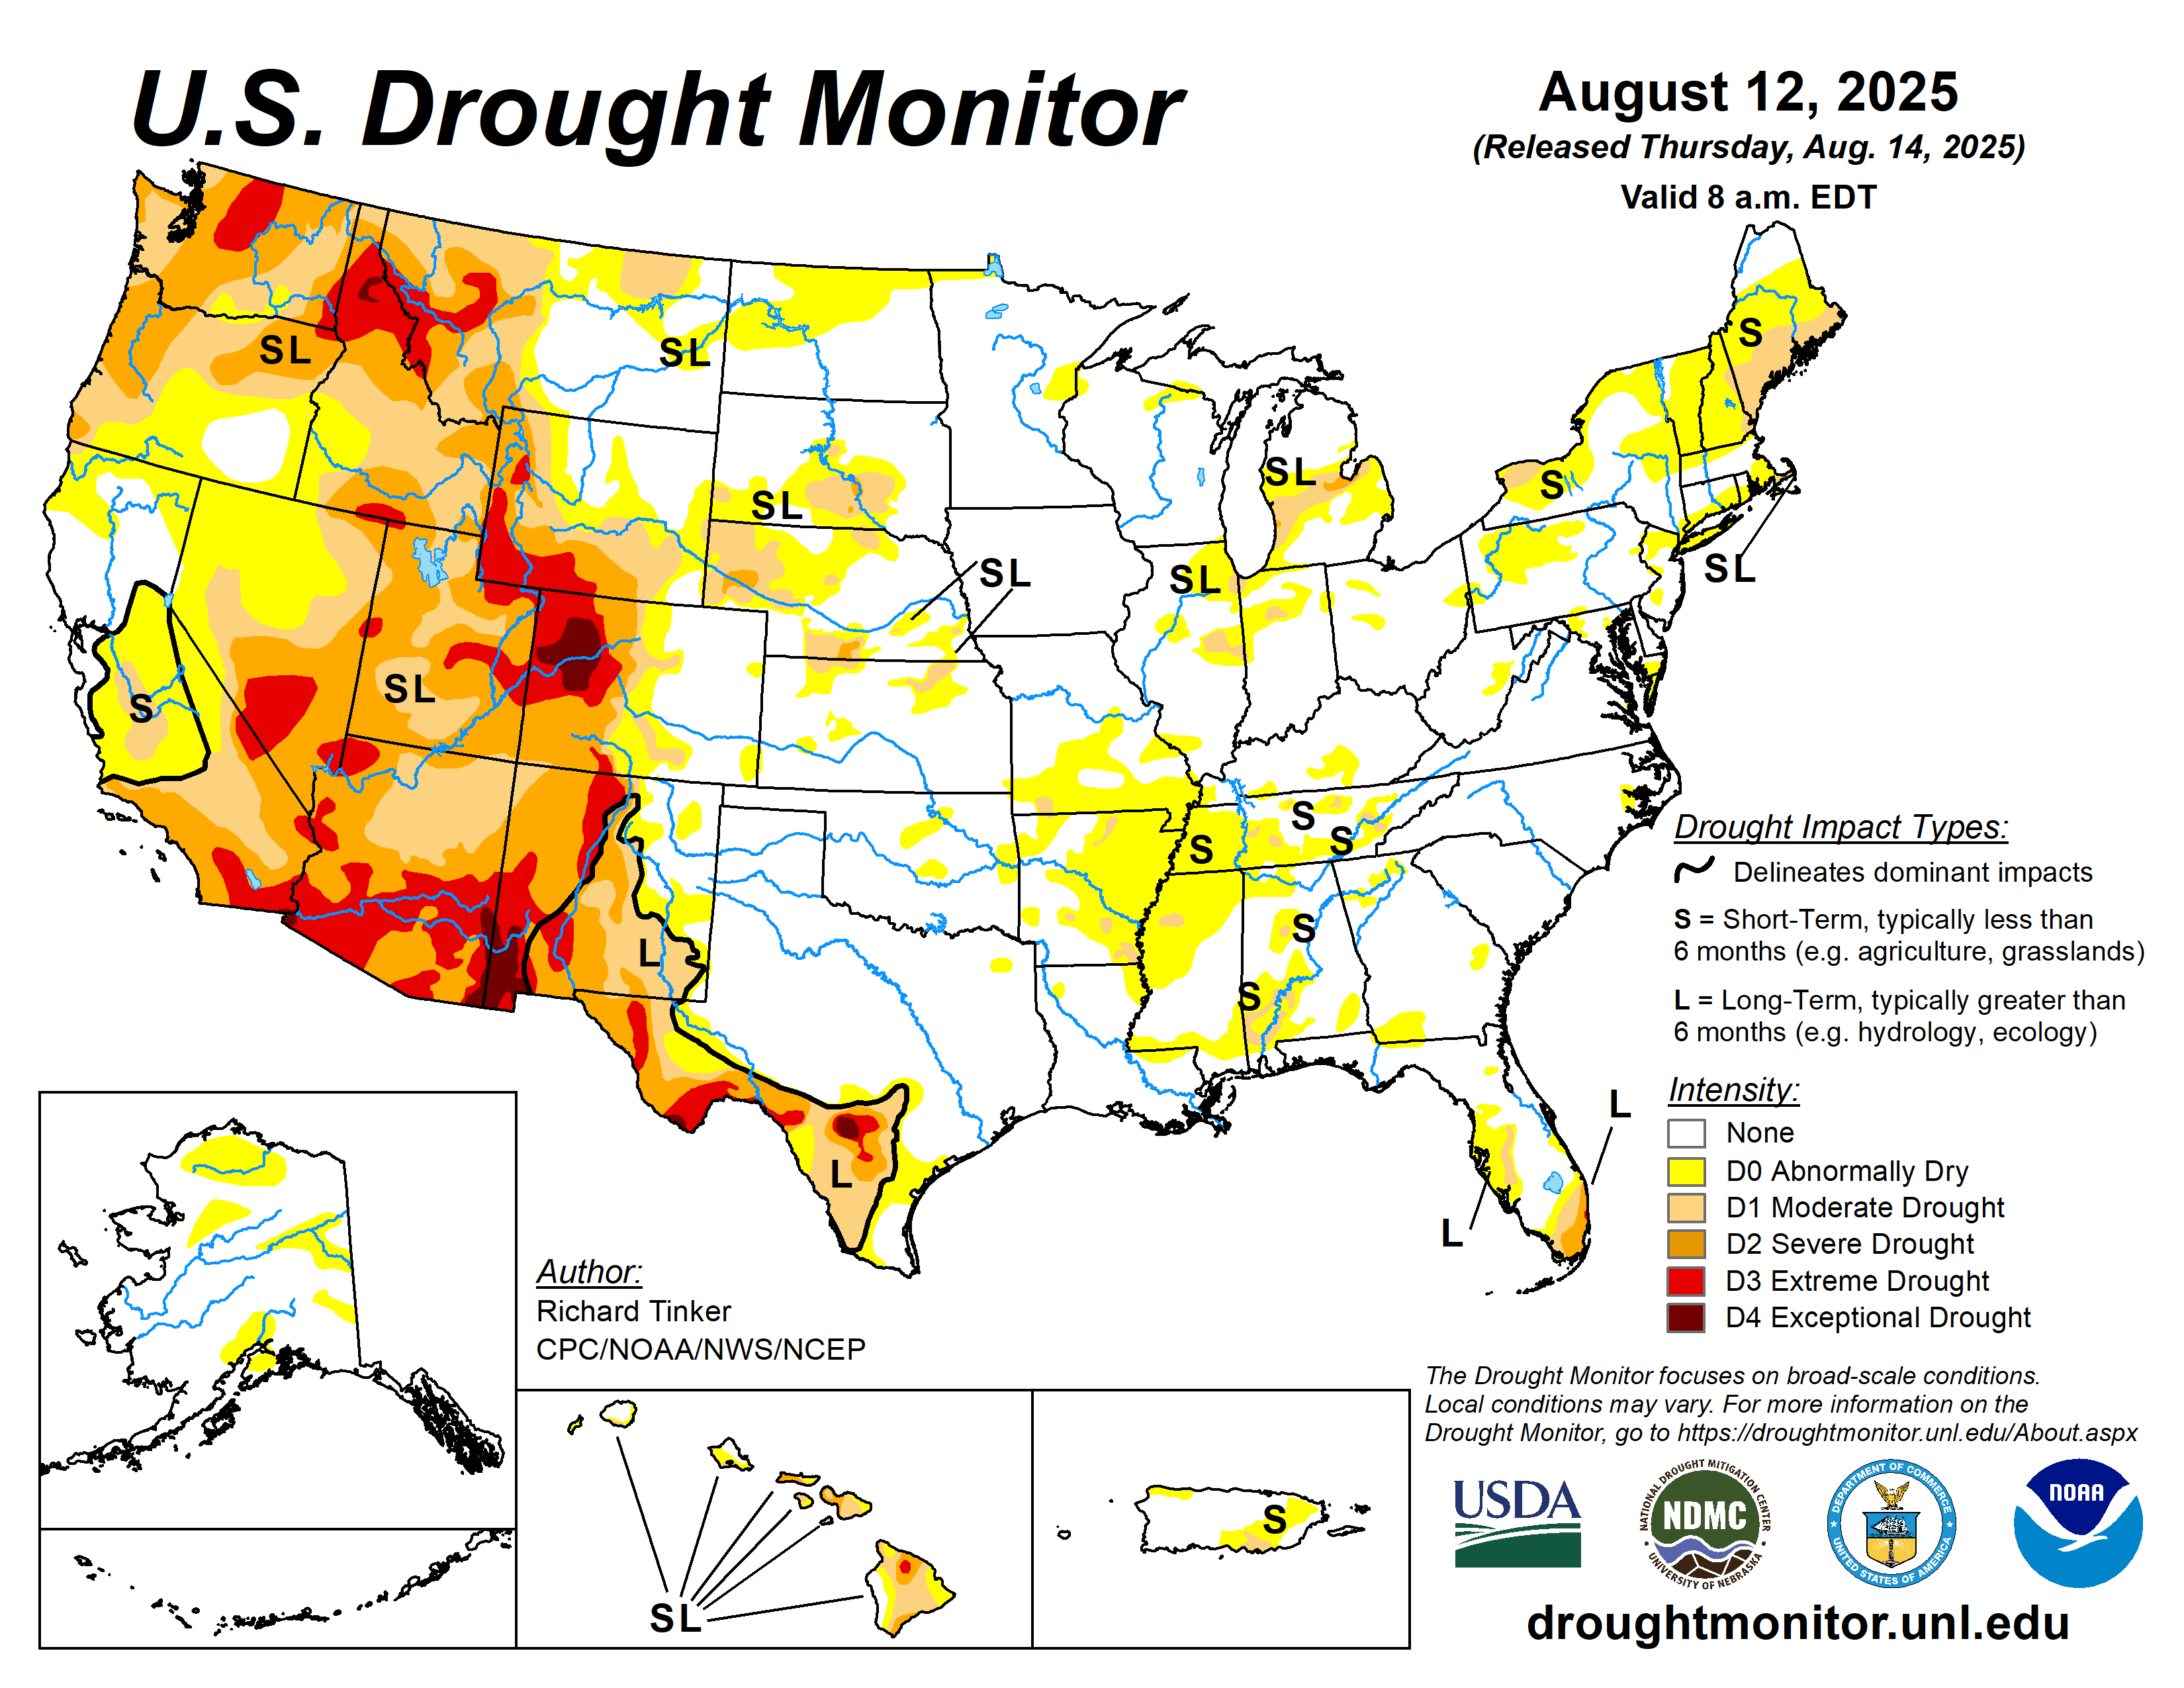
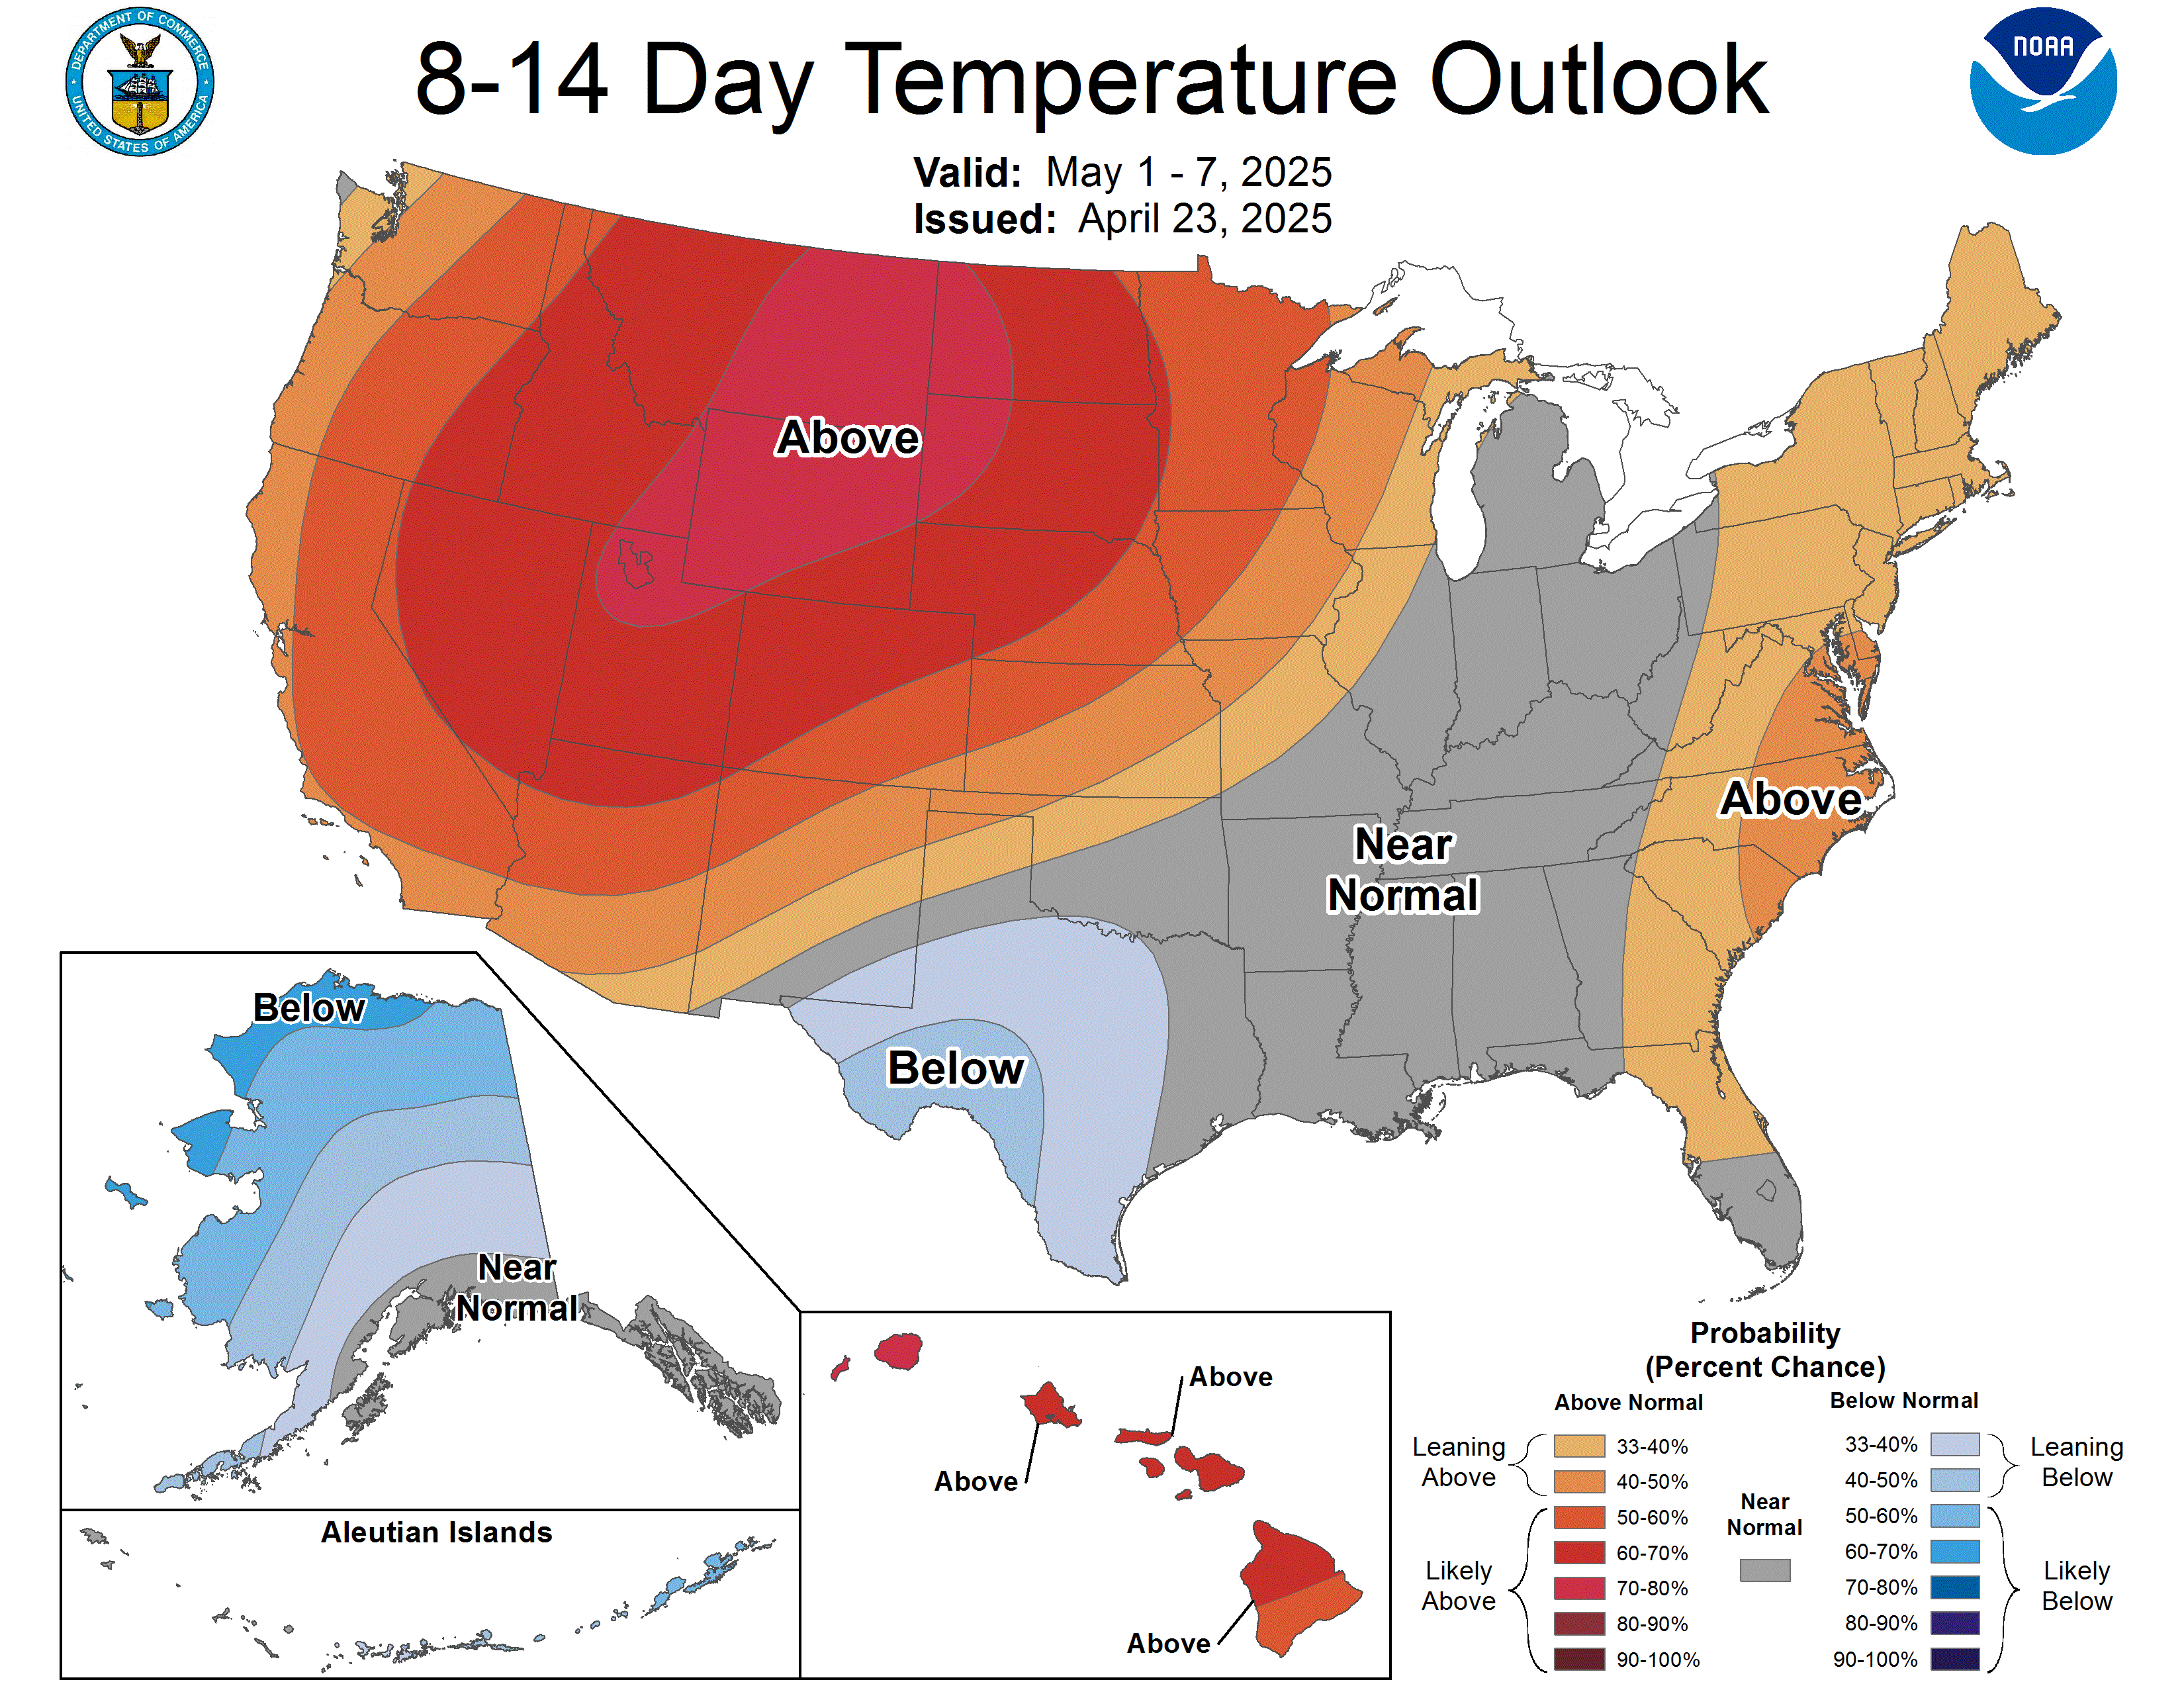
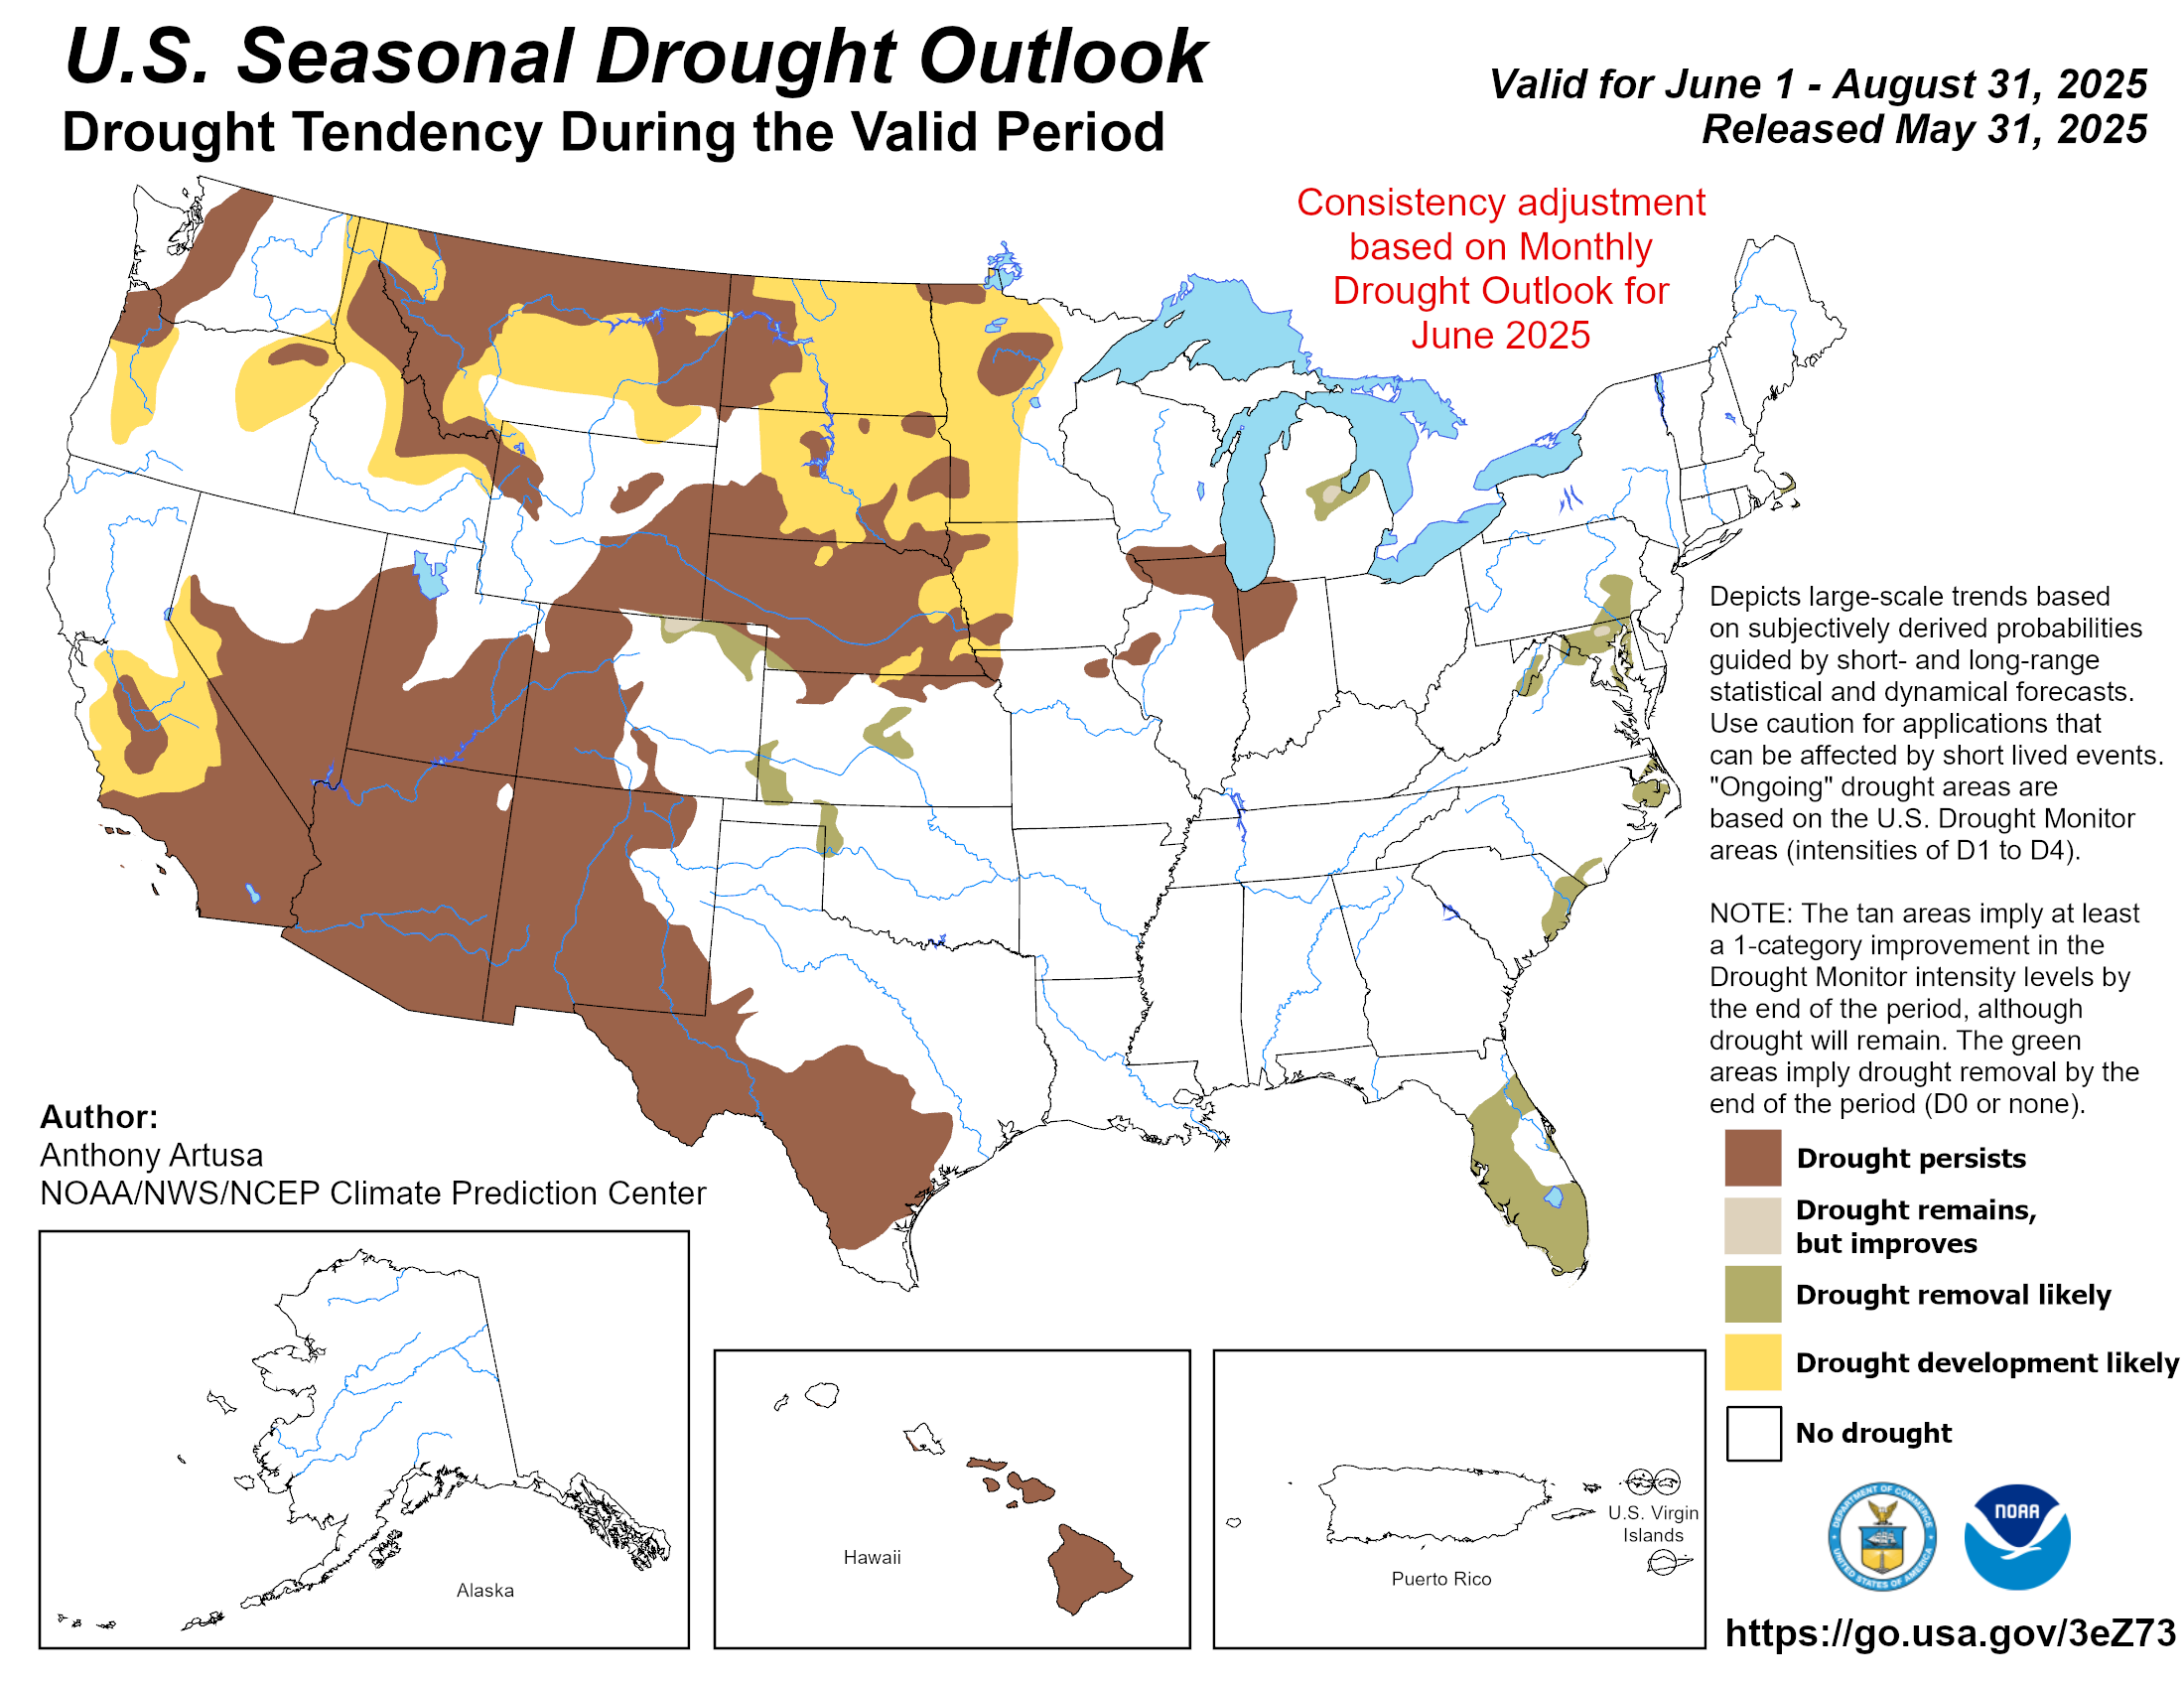
U.S. Drought Monitor map produced by the National Drought Mitigation Center at the University of Nebraska–Lincoln, USDA and NOAA.