El Niño Watch — El Niño & La Niña
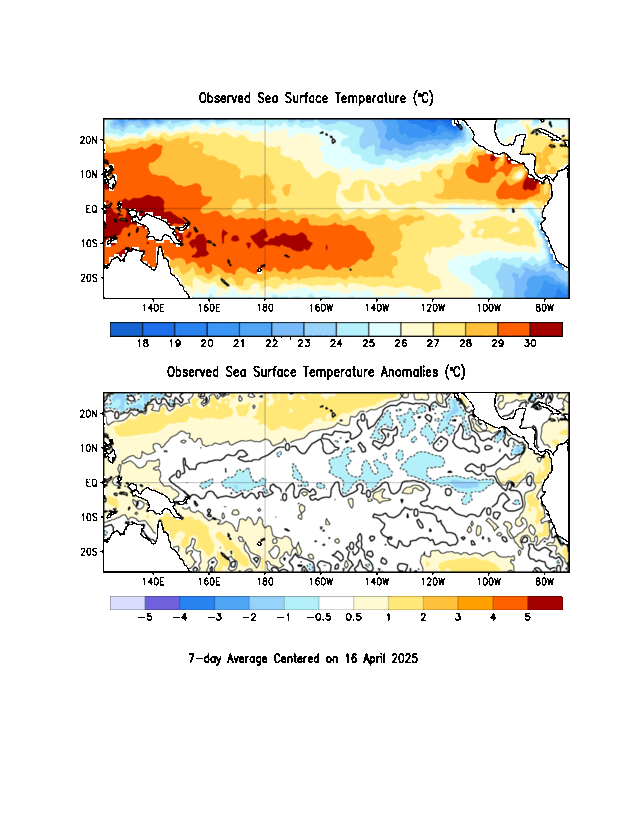
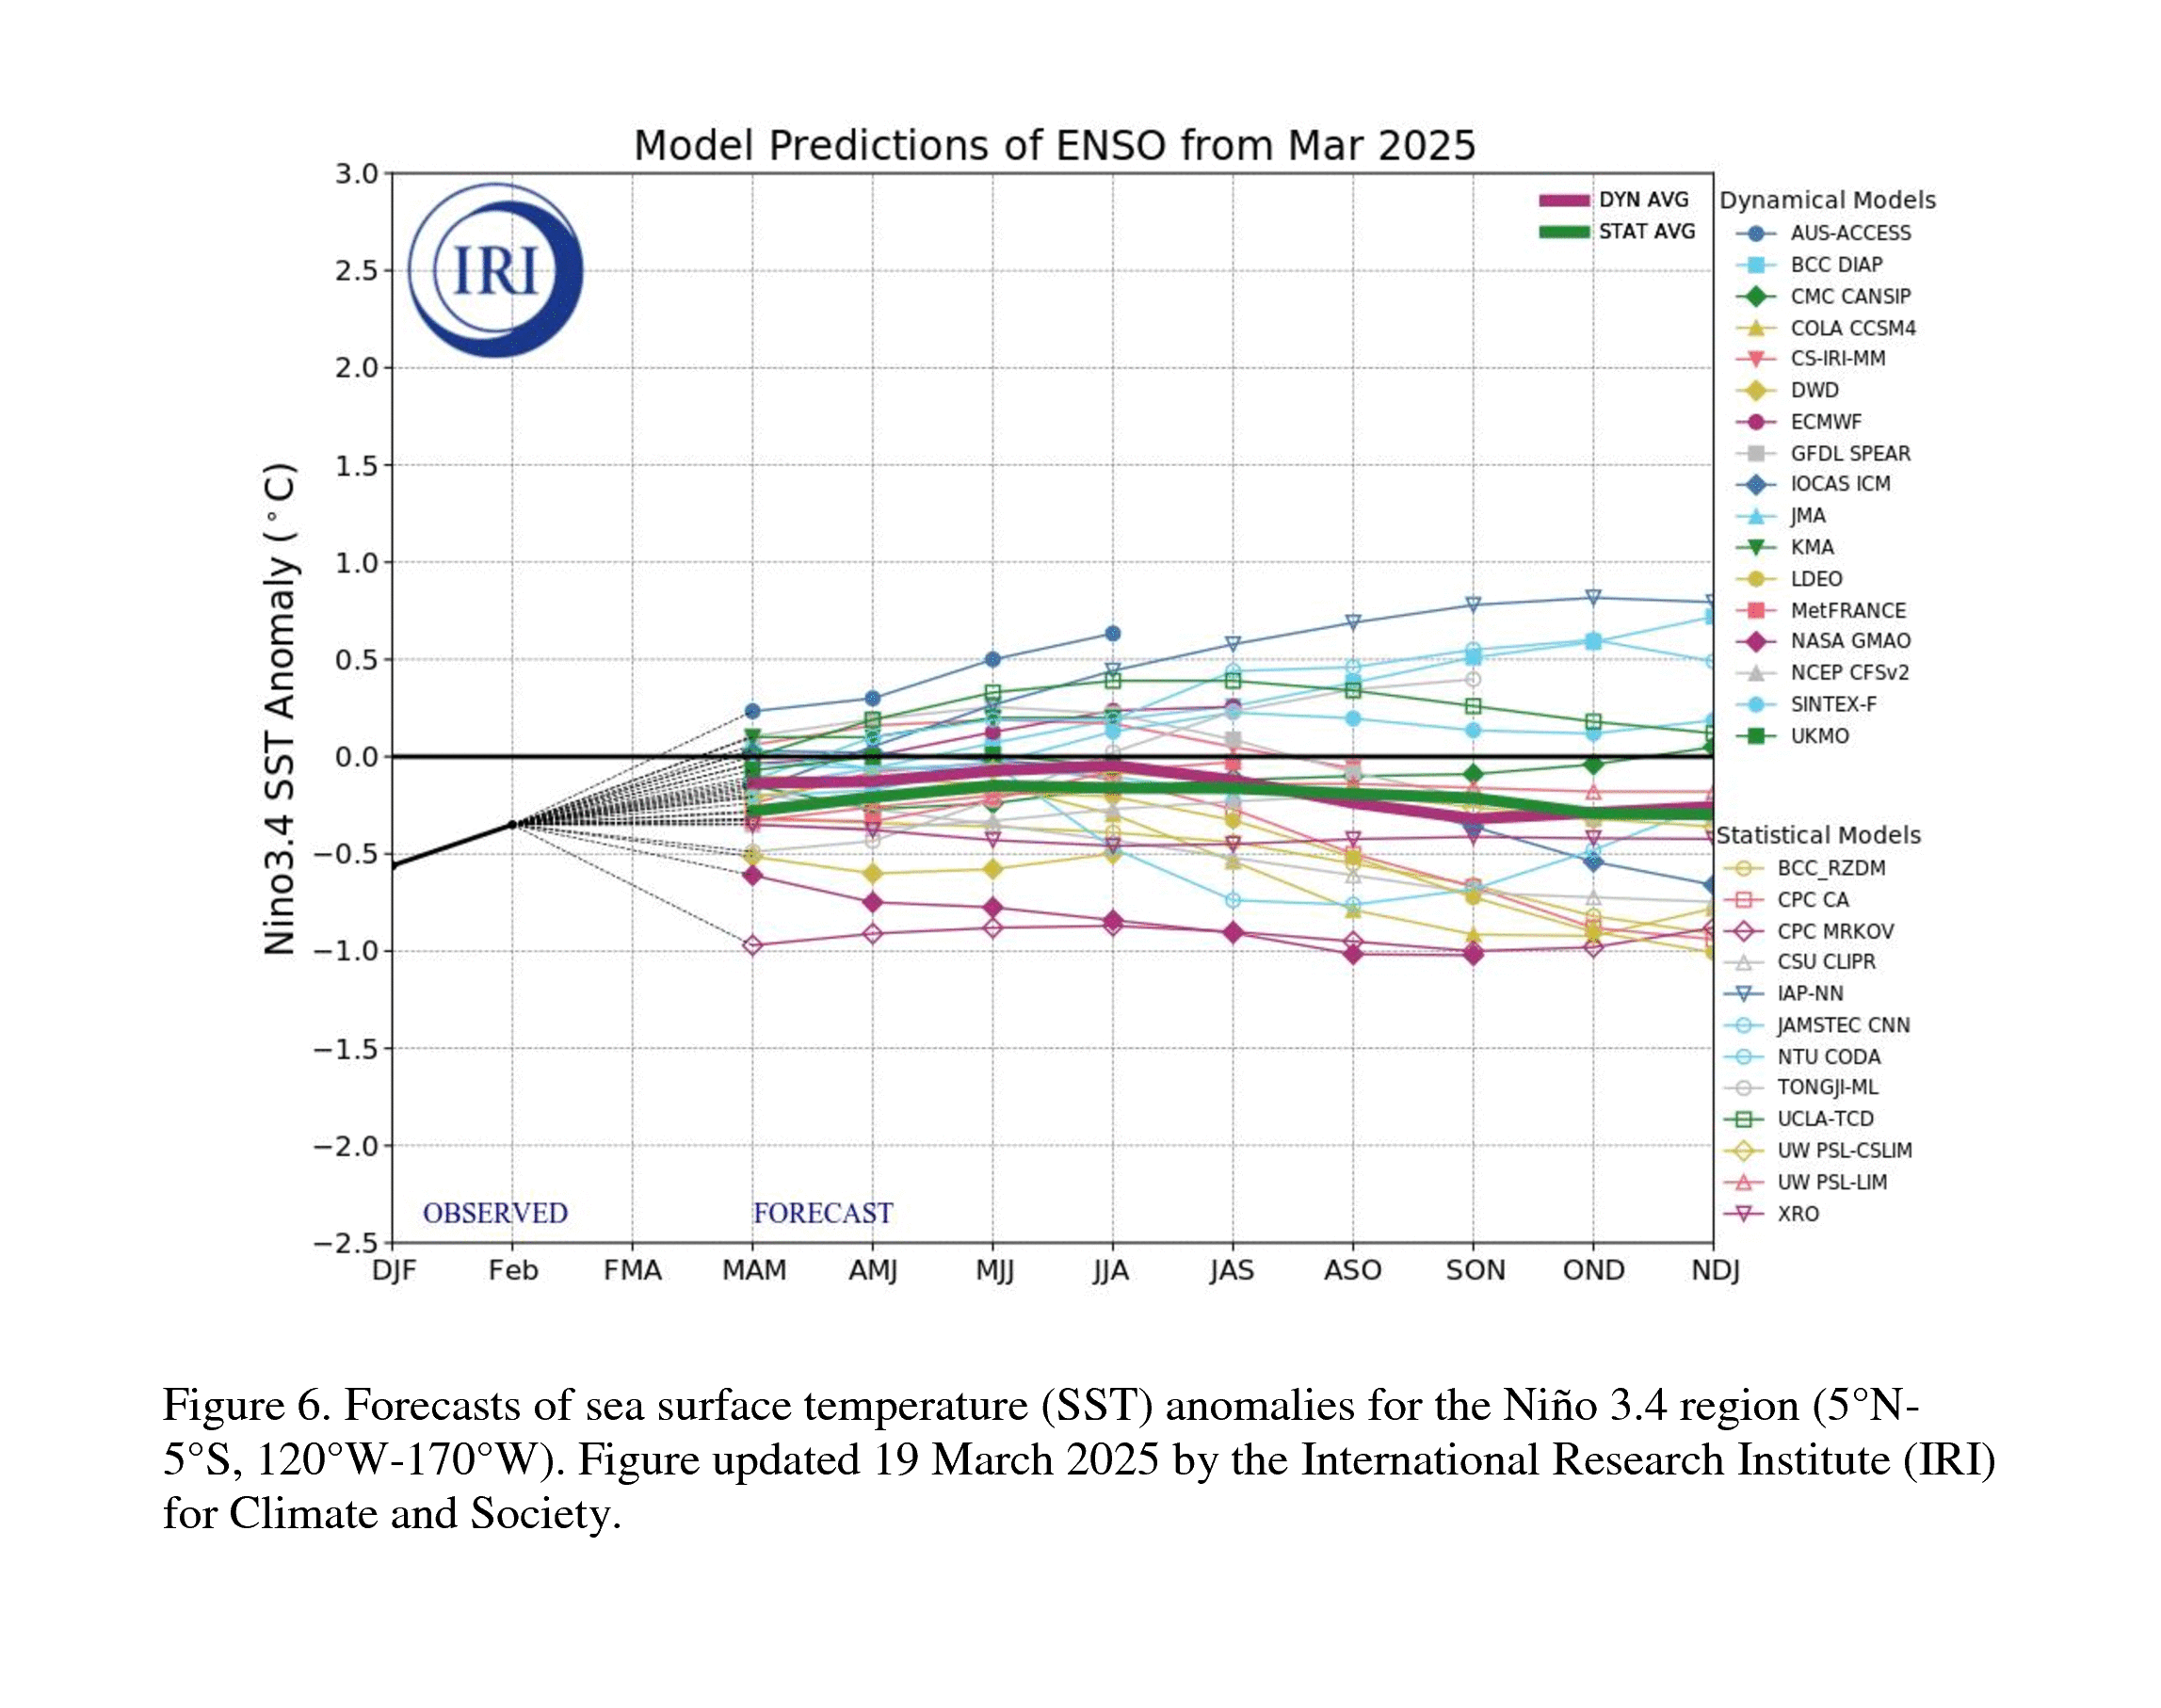
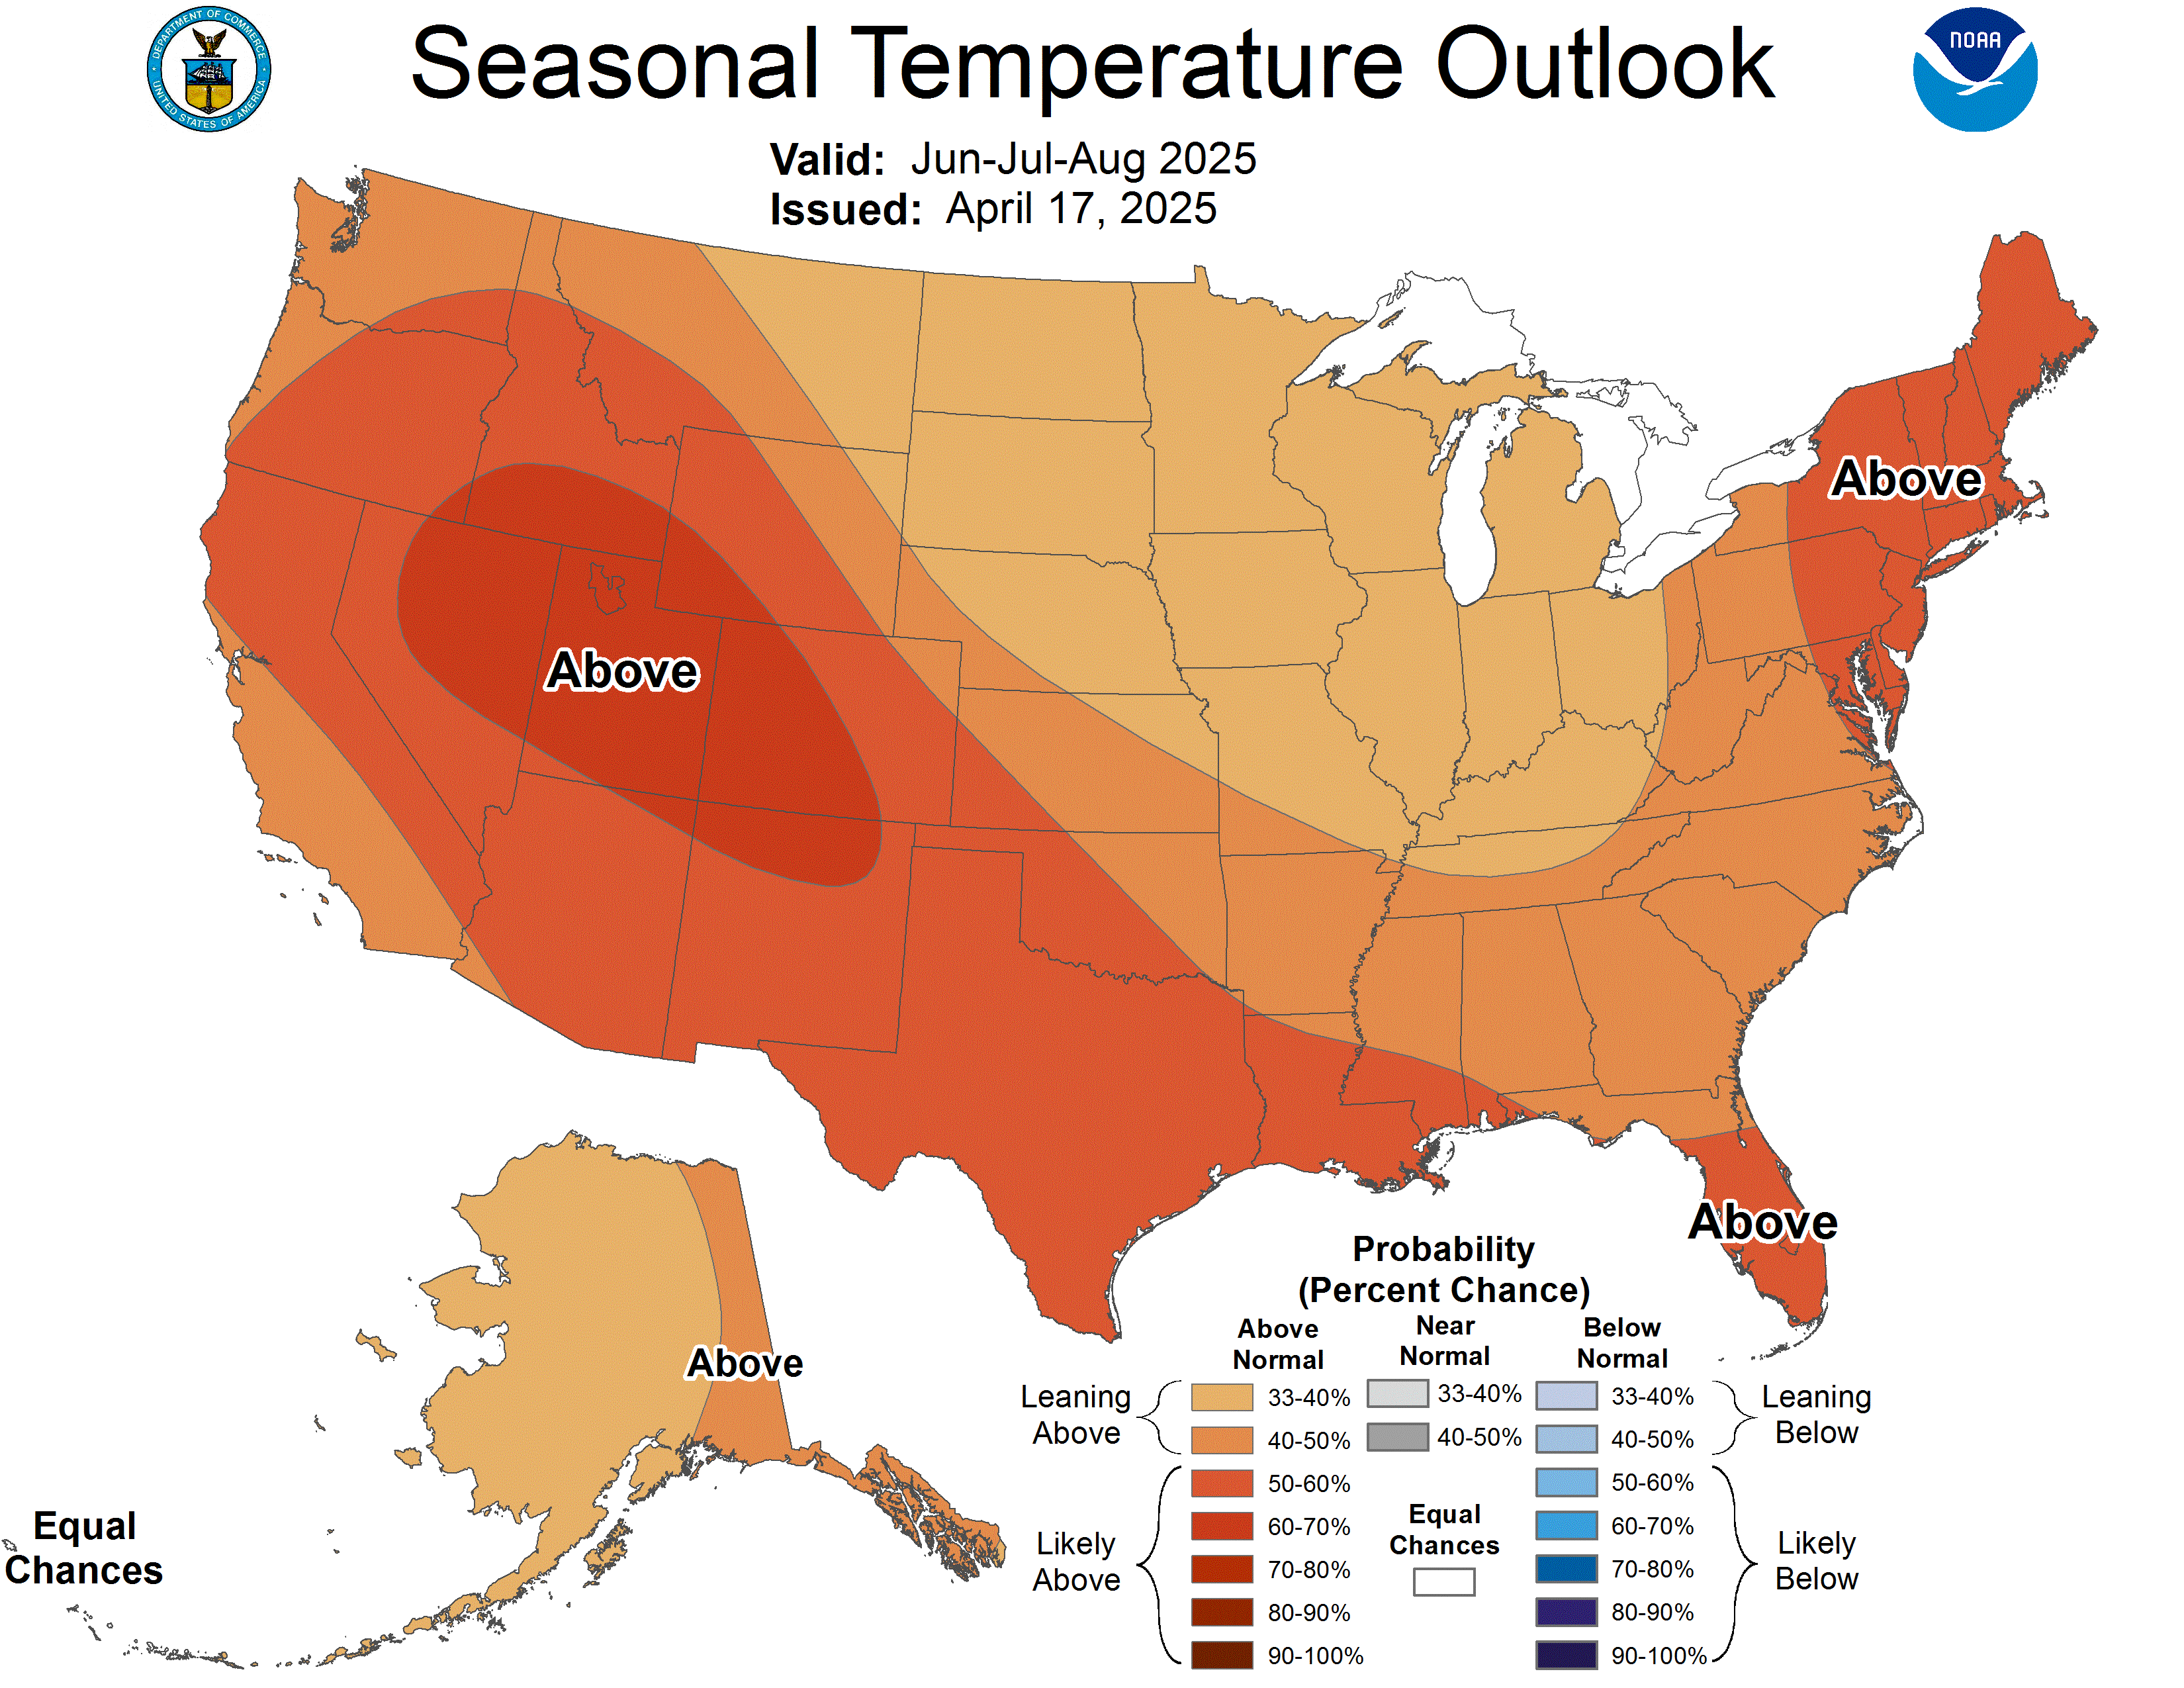
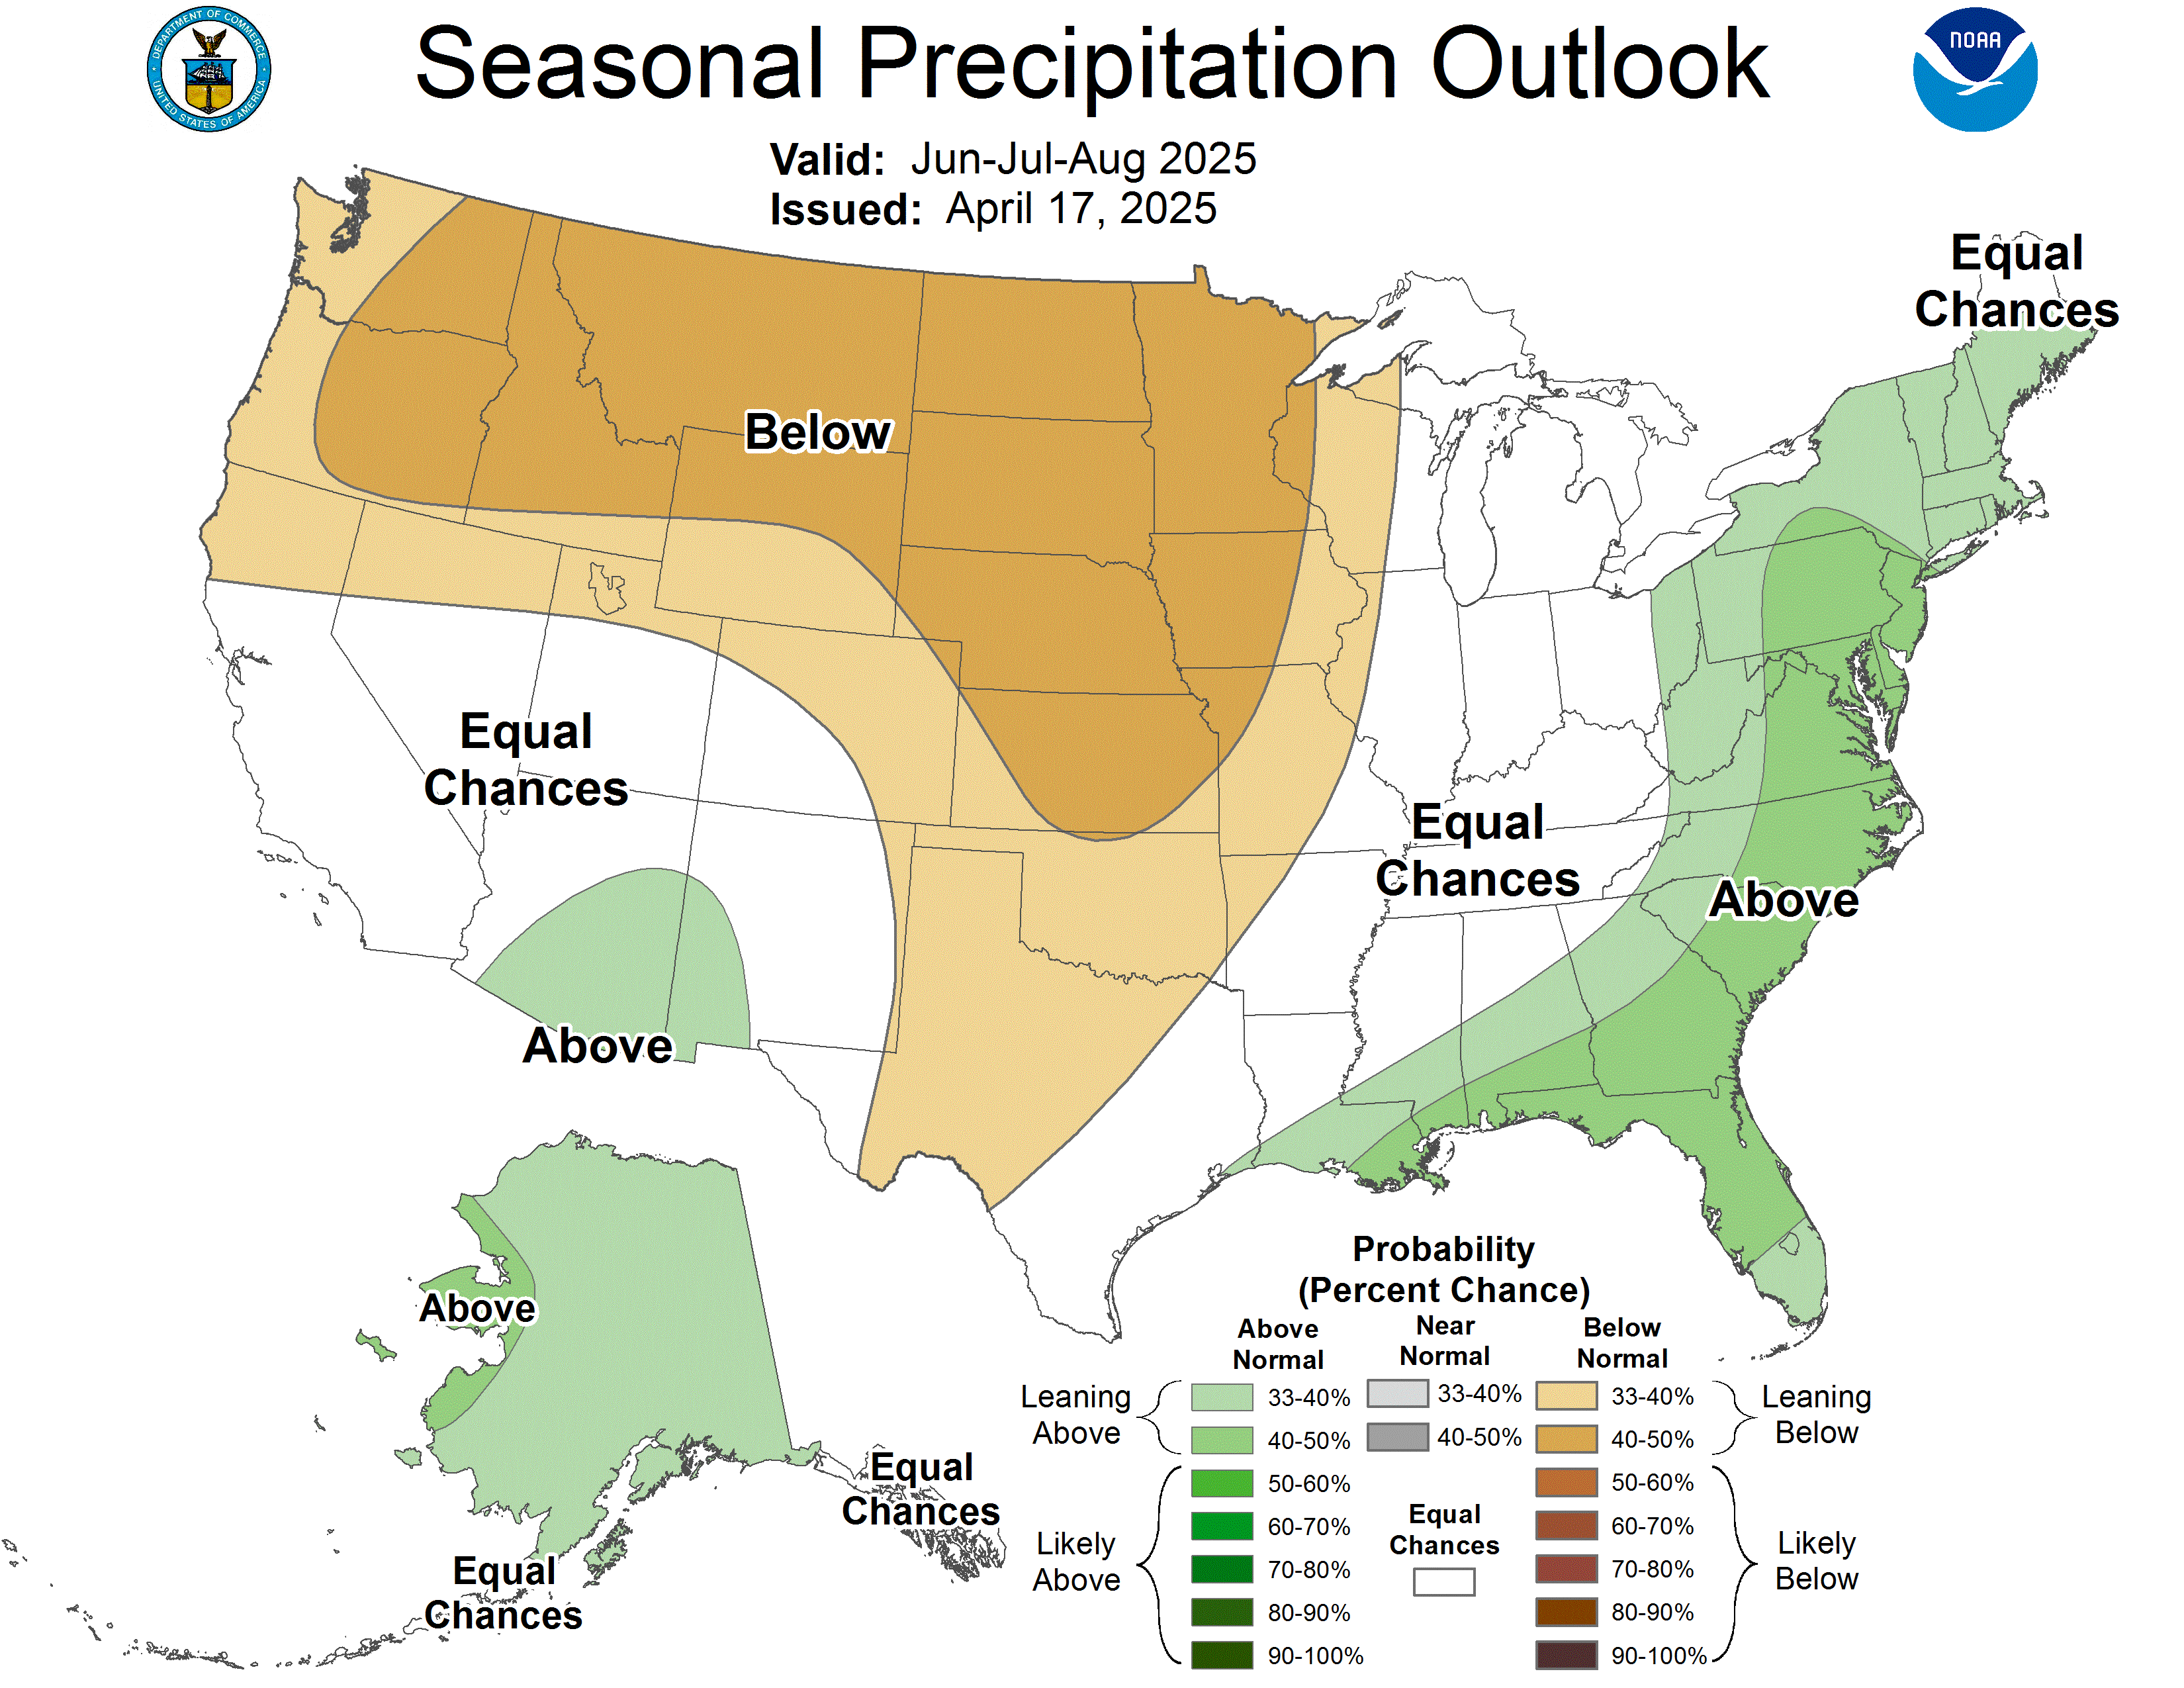
Live Pacific Ocean readings from NOAA, how this El Niño compares to the biggest on record, NOAA’s winter outlook, what to expect at your own ZIP code, and how to get ready for winter where you live. Set your area once and the outlook and prep sections follow it.
Niño 3.4, week by week
Degrees °C above (+) or below (−) normal. +0.5 = El Niño, +1.5 = strong, +2.5 = record territory.
Strongest El Niños and La Niñas since 1950
Peak ONI of each strong event (±1.5 °C or more). Red = El Niño, blue = La Niña; the last bar is this year, still growing.
The Pacific now, the model forecasts, and NOAA’s winter odds
Click any map for the NOAA page. On the winter maps, orange/red = leaning warmer, blue = colder; green = wetter, brown = drier; white = equal chances.
What to expect where you live
Type a ZIP code (or “City, ST”) to see NOAA’s odds for your spot over the next four seasons, any weather alerts there right now, and your local Weather Service office. The outlook and prep sections below will switch to your region too.
NOAA Probabilistic Precipitation Portal (live)
Instead of one rain, snow or ice number, NOAA’s Weather Prediction Center shows the range of amounts that could fall where you live over the next few days — the official forecast, a high-end amount and a low-end amount — plus the odds of getting at least a set amount (for example, at least 1 inch of rain or 4 inches of snow).
- Pick the product: rain (total liquid), snowfall (includes sleet) or ice (freezing rain).
- Pick your area: the whole U.S., your state, or your local NWS office (Birmingham, Huntsville, etc.).
- “Expected Amount” is the official NWS forecast. “High End Amount” has only a 1 in 10 chance of being topped — use it to decide how much to prepare for.
- “Low End Amount” has a 9 in 10 chance of being topped — the least you should count on.
“A very strong El Niño will likely bring a southward and eastward shift to the jet stream … [and] tilts the odds toward stormier weather across the South.” — Ken Graham, NOAA National Weather Service Director
- Warmer than average: northern California, the Pacific Northwest, the Midwest, the Mississippi Valley, much of the East, Alaska, Puerto Rico and the U.S. Virgin Islands.
- Near normal: parts of the Southeast, including Florida (clouds and rain hold temperatures down).
- Equal chances (no lean): Hawaii and much of the Southwest.
- Wetter than average: the whole southern tier from the Southwest to the Southeast, and up the East Coast.
- Drier than average: Hawaii, much of Alaska, the northern Mountain West, parts of the Great Lakes and the western Pacific islands.
- Equal chances: the Intermountain West, northern Plains, Ohio Valley, Puerto Rico and the U.S. Virgin Islands.
- Likely to improve or end: the Southwest, Southern Plains, Southeast and parts of the East Coast.
- Likely to get worse: the northern Rockies, northeast Oregon and eastern Washington.
- NOAA’s Probabilistic Precipitation Portal is now fully running — it shows the odds of different rain and snow amounts for your area, not just one number.
- Some Blizzard and Ice Storm Warnings will now carry “Particularly Dangerous Situation” wording for the worst events.
Issued Oct 15, 2026. Next update November 19, 2026.
NOAA — El Niño looms large over U.S. Winter Outlook (Oct 15, 2026)